
Common Solutions
Cleaning and Editing Operation Data
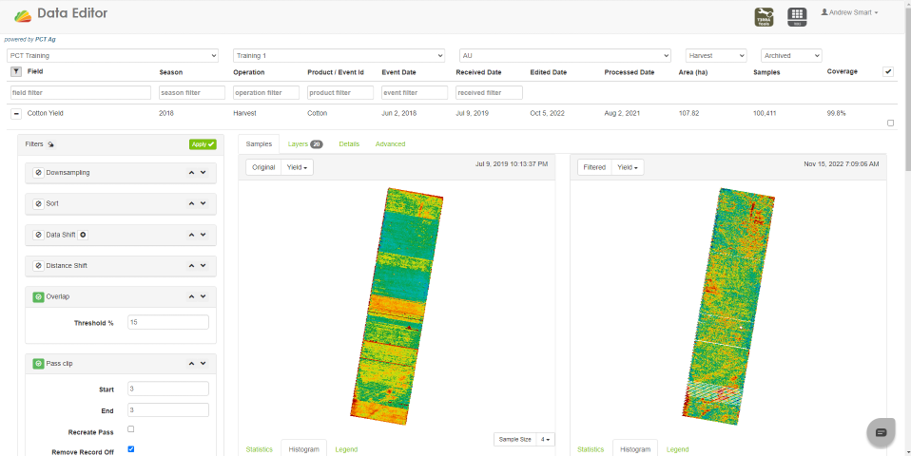
In particular multiple machines cause strips in the data which makes data use limited.
PCT Agcloud has learned automated correction workflows embedded to run when data hits our platform. PCT Agcloud also has many manual tools for those few cases where our automation doesn’t do the trick.
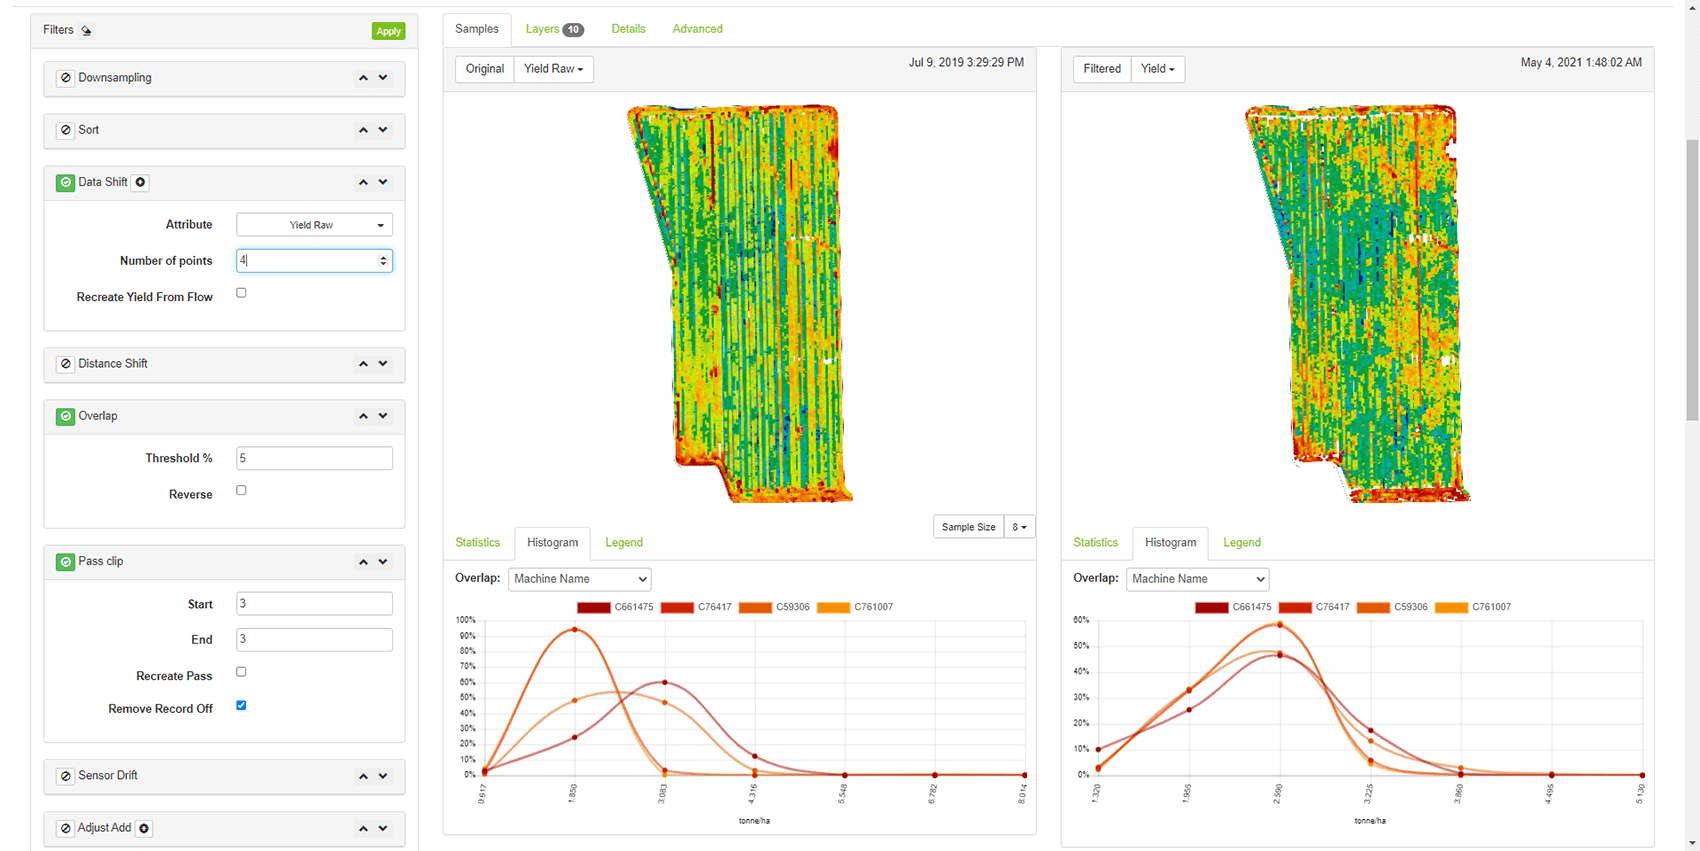
Wheat yield from four machines above.
Cotton yield from 4 pickers below
Basic Zones
Create zones from single layers intersecting two or three layers is all doable in our Zone Locate tool.
Manually locates soil samples or use our advanced soil site locator.
If your looking for more advanced clustering and sampling locating for soil classification work check out Advanced Zones under our speciality solutions.
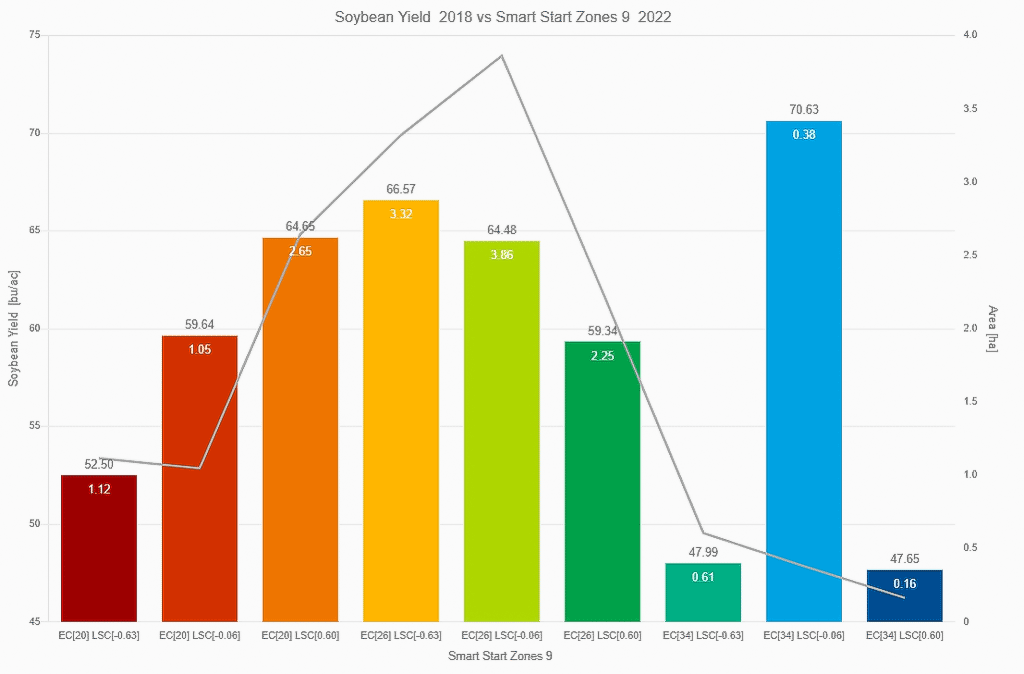
The example below looks at the intersecting zones of and EC survey and Landscape Change which is identify changes in the landscape that influence water movement.
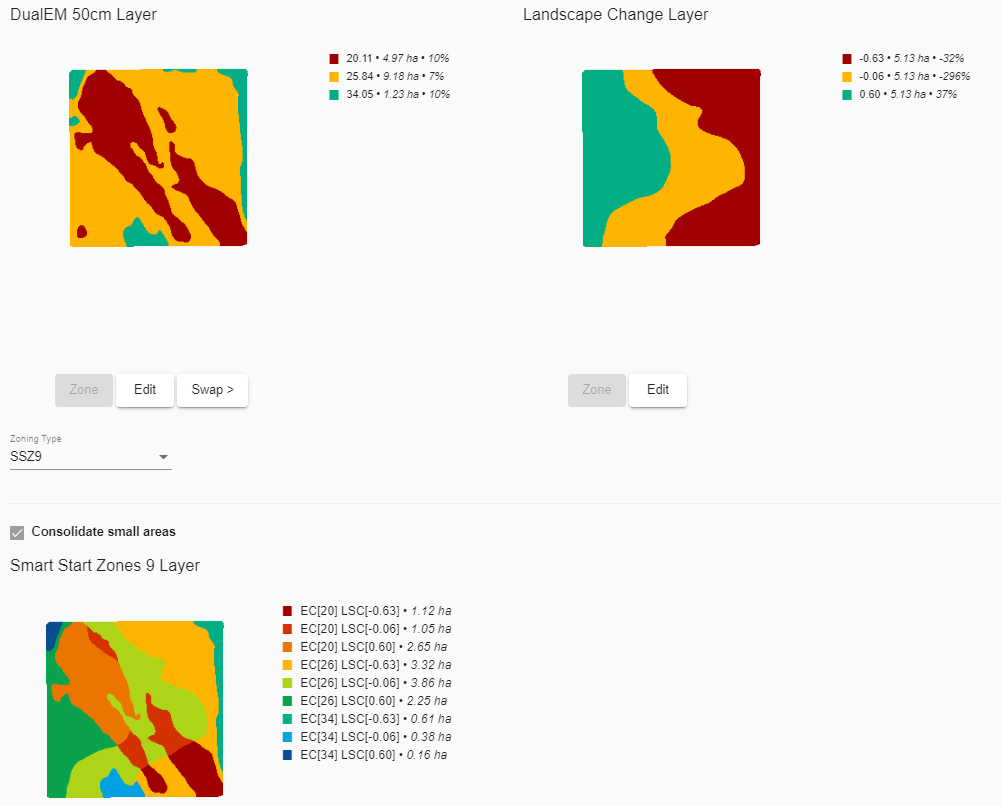
Yield can be overlaid to identify the yield capacity of a zone in any give year or crop type.
Creating a Single Product Prescription
PCT Agcloud prescription writing tools allow the user to zone data in different ways and enter in rates to apply in a planting or spraying operation.
PCT Agcloud will send a shape file to John Deere Operation Centre and direct to a connected machine, Agworld and CNH.
Rx can be used to create prescriptions for Seeding/Planting and application of a single product for one or multiple fields. Once zoned enter your rates
Creating a Multi Product Prescription
Multi Rx can be used to create prescriptions for Seeding/Planting, application, and tillage of a single or multiple products for the selected field.

- In view Select a single farm and field and click MultiRx
- Select a single layer.
- Pick a product type
- Pick a product from the dropdown or use the + button to manually enter a product
- If creating rx for multiple products click add another product
- Choose a zone type – number of zones. (if already a zoned map, no need to change anything)
- Smooth Map and Remove Small zones are options to simplify the Rx.
- Click Run Rx

- Once the zoned map appears, enter your rates
- Click Save Shape files – a shape file (zipped) and PDF of the application maps will automatically download.
– Simplify Shapefile will reduce the number of points per polygon and file size.
– You can also send the layer and shapefile straight to My JohnDeere

Creating a Prescription using Formulas
Once formulas have been set up and saved in Add/Edit formulas you can run the formulas in Formula Rx by selecting desired fields and formulas.

Here are some explanations for the dropdowns and entry boxes.
Settings
 Resample cell size – Allows you to change the pixel size used to create the Rx. Typically the default is used for grid sampling. You may want to change the resample size to 2m for zones as it’s the resolution we store layers.
Appy Cell size to shapefile only – When check will save the layer with the default cell size, but the shapefile will be the entered Resample cell size
Target Activity Date – Can enter desired activity date
Formula Group – Let you choose the formula group set up in Add/Edit Formulas
Products – Default will let you choose formulas set up with expressions. When clicked will take you to products to be used with Soil Rec Layers

Product – Set up in Add/Edit Formulas. If no product is listed the nutrient rec layer created at the end can be used with products.
Formula Name – Set up in Add/Edit Formulas
Season – Select the season the soil sampling or desired layers form expression are saved in
Depth – If depth is saved with soil sampling data you can select the depth. If multiple depths are selected it will calculate a weighted average.
>0 – Needs be run with an entered min. Any number between 0 and the min will round up to the min. Any number calculated to be 0 or below will be 0.
Units – Units the resulting layer will be saved in
Min – Any calculated value below the entered number will be rounded up to that number
Max – Any calculated value aove the entered number will be rounded down to that number
Split – Will split the calculated result into multiple applications based on the % separated by commas entered in the Max Column. The example below will apply 50% of the total to first application and 25% to the following 2 applications.
 Available Product – You can enter the amount of total product available to be spread over field/fields so the resulting variable rate maps totals equal the available product.
Set Average Rate – Allows you to set a desired average rate per variable rate rx
Cost – Price per unit of product
Flat Credit – Will subtract the entered value from the rx
Credit Layer – Will subtract the layer selected from the rx
Field Selection

Name – Field name
Crop – Will default to the first and second crops listed in the expression
Type – Flat – you can enter a flat yield goal in the gray box to the right
Mean – Will use a flat mean from the yield layer/layers selected in Season 1 Dropdown. If multiple are selected they will be averaged.
Grid – Will use the actual yield layer/layers selected from the Season 1 Dropdown. If multiple are selected they will be averaged.
Create Rx

Create Rx – Once all parameters have been entered you can click create rx to see a quick breakdown of the Rx and the layers used to create it. If the selected rx is set up with a product then you can move on to shapefile creation.

If the rx has no product and is creating a Soil Nutrient Rec you can click the Select Layers and switch to product button which will take you the same place as clicking the Products Slider described above

Products – Here we can convert Soil Nutrient Rec and Nutrient Crop Removal layers to actual product.

Strip Trial Analysis
Strip trials contain replicated zones of varying applications or management practices (variety, fertilizer, seed rate, tillage, etc.). They are used to compare different treatments so that the grower can analyze them and make management decisions based on the results.
The Analytics tool in PCT Agcloud contains a strip trial application, which is specialized for helping growers visualize the differences between strip trials.
A tutorial video outlining this process can be found at this link: https://youtu.be/rpzLLhq8ti0
Steps:
In the examples shown below, strips of different varieties will be compared to yield.
1. The strip trial analysis tool can be accessed in the Analytics tool by selecting the desired field and clicking the ‘Strip Trial’ tab as seen in the example below, or by clicking the ‘Strip Trial Analysis’ button in the Right Click Menu of the View tool. Once you are in the strip trial analysis application, select the desired season (left column), layer types (right column), and yield/remote layers. Then, click ‘Run Analysis’.

2. After the analysis has been run you will see the zone maps of the selected layers. You can edit the zones, names, colors, etc. of these either of these maps using their respected ‘Edit’ buttons.

3. Next, is the yield comparison tool. Select the desired season and layer by which to compare the strip trial to. A graph and multiple tables will appear below. Additional layers can be added to the analysis via the ‘2nd layer’ dropdown.

4. Above the treatment analysis tables, you have the option to enter dollar amounts for the yield revenue. After entering this data, the tables below will display calculations based on these costs.

5. Lastly, at the bottom of the page, enter the desired product and application date and click ‘Print Report’ to receive a pdf. form of the analysis.
